How to Debug JavaScript Apps
JavaScript frameworks and libraries for building web applications have exploded in recent years. Also, JavaScript itself continues to be the most popular language for developers. As frameworks have been able to accomplish more, more is likely to go wrong. Debugging high-traffic or business-critical JavaScript apps is typically a cat and mouse game. A user will self-report a bug (or they won’t), then support or engineering tries to get more information about what went wrong or screenshots of the issues, then engineering tries to reproduce the bug. This process is incredibly time consuming, and sometimes the bug is never fixed.
Debugging JavaScript apps is difficult for a number of reasons, but our customers often cite the huge variation in operating systems, browsers, and devices, replicating state, and the disconnect between client-side experience versus what is logged server-side.
What are some methods for debugging JavaScript apps?
Browser: typically if an app encounters an issue, a developer will do the best to recreate the environment it occured in. Once the bug is recreated, the tools available within most modern browsers are incredibly helpful.
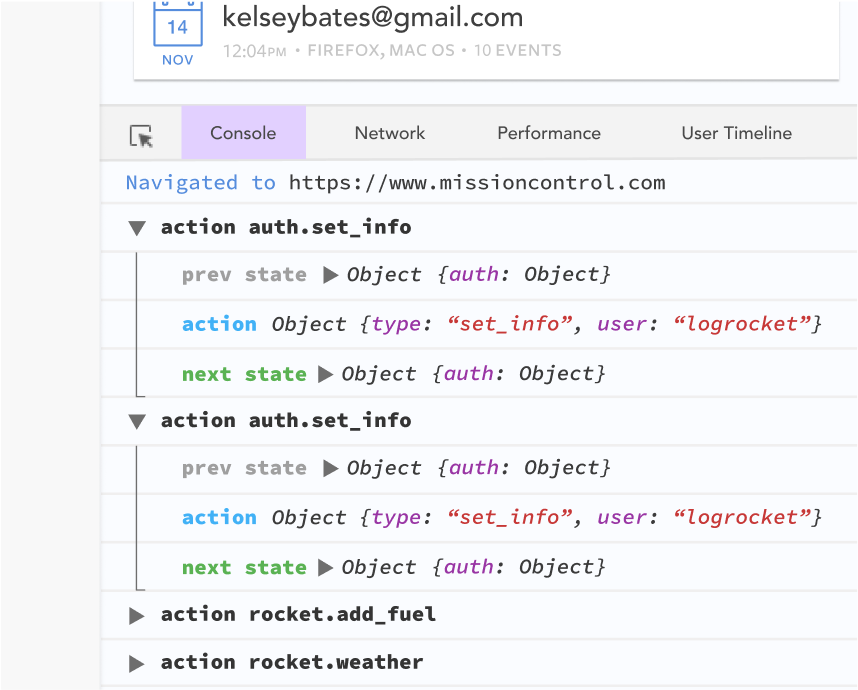
- Console API: When an exception occurs in a JavaScript app an error is automatically thrown into the console of the browser. If this happens, it is usually immediately clear what the issue is, and a developer can see exactly where in the codebase the issue occurred. In addition, using the console API to log specific events like console.log() or console.warn() may give more context into where a bug occurred and why.
- Plug ins and extensions: Many browsers have a rich ecosystem of 3rd party plug-ins or extensions which can help with the debugging process. Many frameworks have their own extensions which display more robust information about the app. A quick search for “JavaScript” in the Chrome extension store yields a number of useful tools.
Framework specific: It’s safe to say that most “JavaScript apps” actually refer to a JavaScript framework. When it comes to debugging these apps, each framework has logging and debugging tools specific to how the framework is built and behaves. Some examples from the most popular:
- React: React has a number of different logging tools, but the main concept is implementing error boundaries. Error boundaries help isolate broken components from affecting other parts of an app and display more helpful error messages.
- Angular: Angular has built-in methods such as httpInterceptor or ErrorHandler to implement custom logging.
- Vue.js: Vue has the errorCaptured hook which will only get errors from child components but can be used to create an error boundary similar to React.
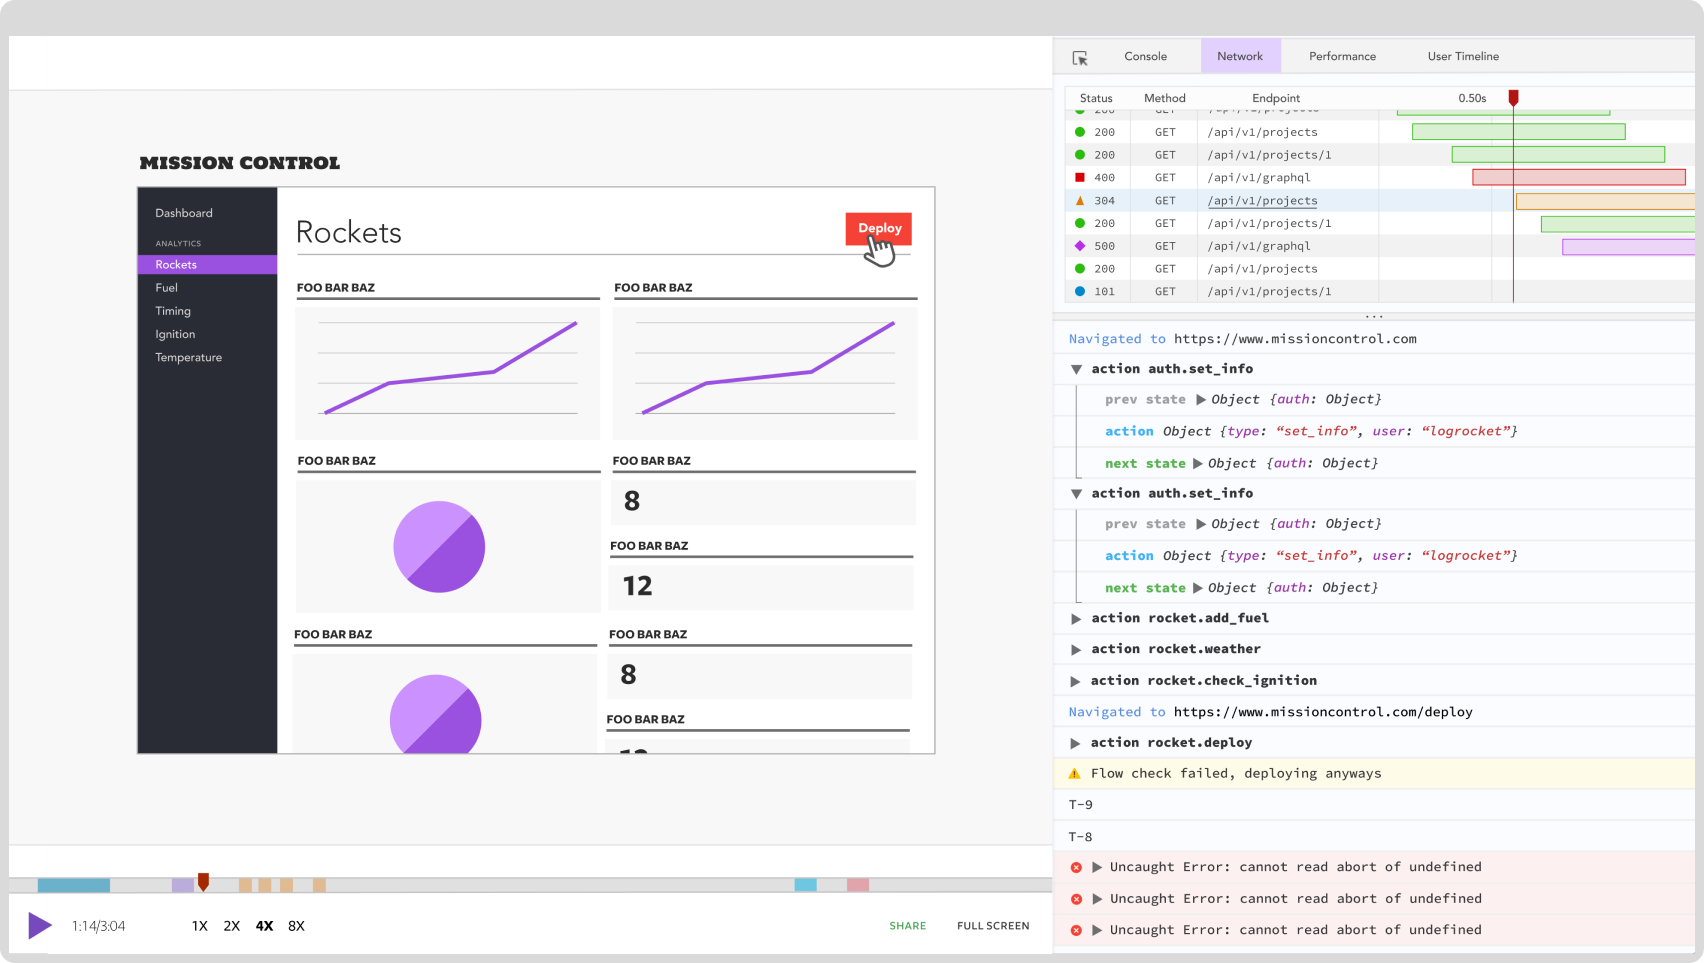
While it’s important to implement the classic debugging strategies for JavaScript apps, getting insight into exactly what a user did that led to a bug helps developers more quickly understand what went wrong. Being able to immediately reproduce the issue and see all errors or log a user saw makes identifying and pushing a fix much easier. If this sounds good to you, get a free trial of LogRocket today.