Frontend application monitoring
Identify issues, aggregate errors, and monitor performance for seamless user experiences
Identify issues, aggregate errors, and monitor performance for seamless user experiences
Table of Contents
In the early 2000s, web applications were simple HTML pages backed by more complex services on the backend. Nowadays, frontend applications can be just as complex as the backend because they need to support a wide variety of users and devices while remaining performant and easy to use.
The growing complexity of frontend applications has led to a new type of monitoring solution — frontend application monitoring — which helps software teams ensure great digital experiences for all their users.
Frontend application monitoring encompasses a set of tools used to observe and analyze an application’s performance, user experience, and potential issues from the user’s perspective.
While backend application performance monitoring relies on observability through traces, metrics, and logs, frontend application performance monitoring involves three main data types:
Collecting and leveraging this data efficiently helps developers create more seamless user experiences.
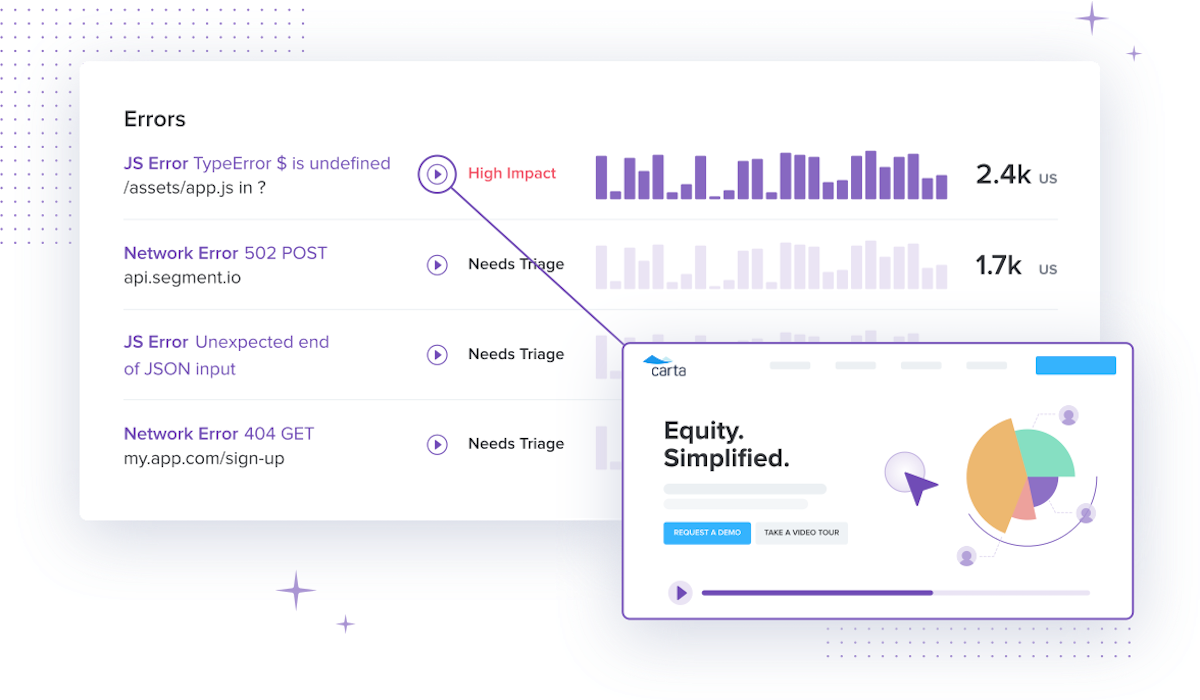
Error tracking involves capturing runtime errors in applications and providing detailed information about the environment and user actions leading up to the error. This can help you:
However, logging and tracking JavaScript errors can quickly become an overwhelming and time-consuming task. Users may encounter different errors depending on the exact device, browser, platform, or version they used. Errors may be caused by network issues, third-party scripts, or unpredictable user behaviors.
Having a sophisticated frontend monitoring solution like LogRocket in place can mitigate the challenges of error tracking and help you efficiently improve application performance.

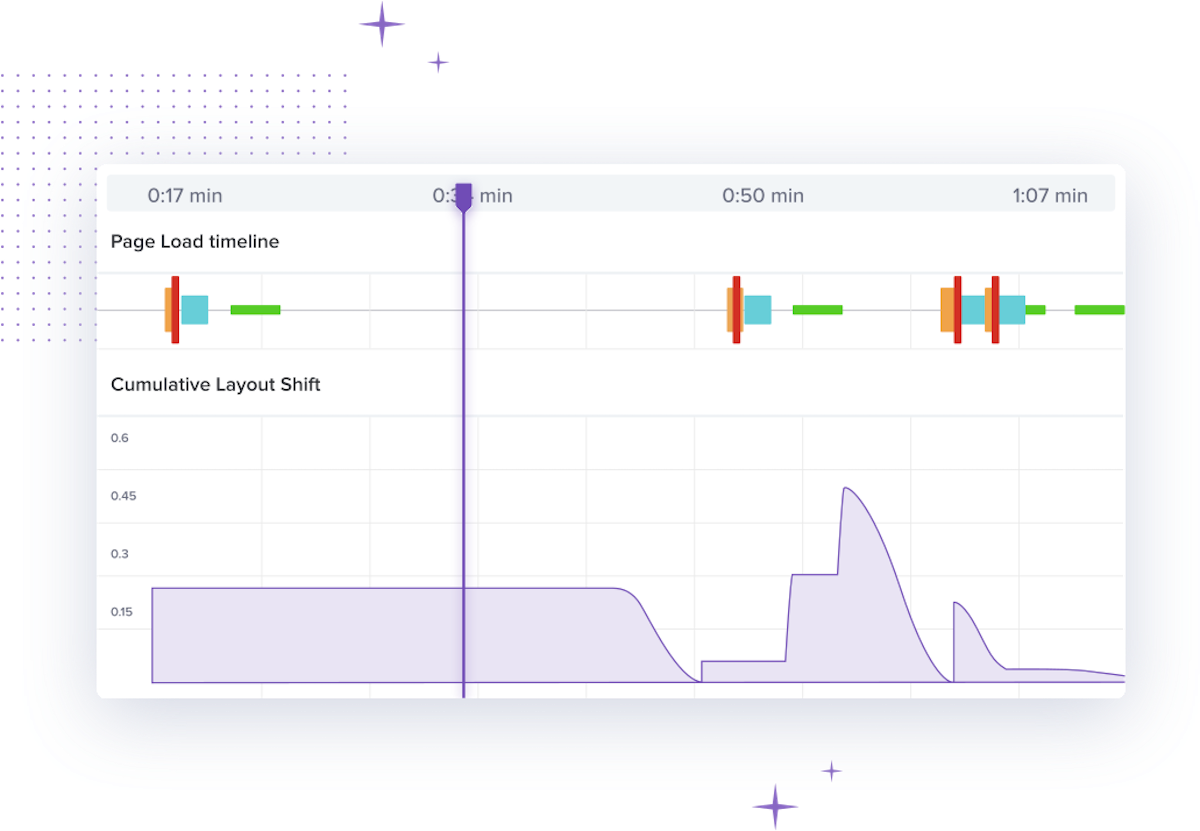
Performance monitoring focuses on evaluating KPIs like page load times, rendering times, and API response times that directly influence an app's overall usability. For example:
There are many factors that contribute to an application’s performance, so it can be difficult to find the right balance between optimization efforts and development resources. Choose a tool that provides a clear and comprehensive picture of your frontend application’s performance to ensure you’re spending your time and effort where it matters most.

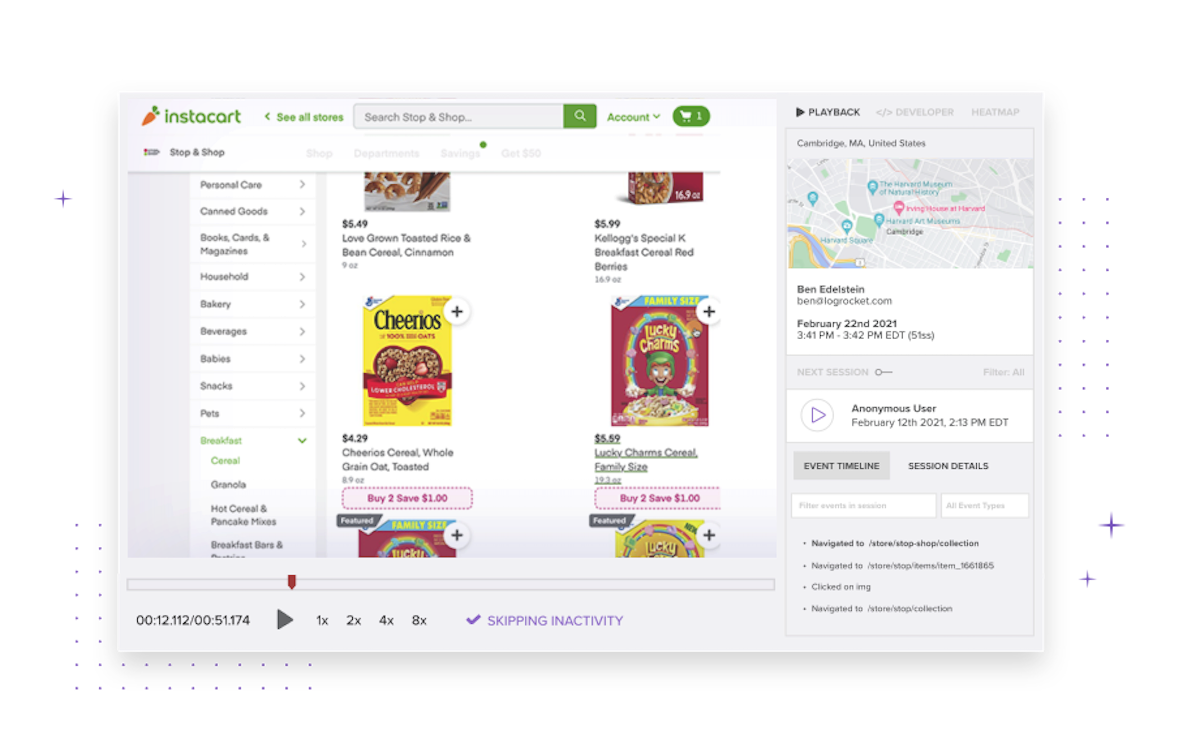
Using a session replay tool to help with frontend application monitoring can provide a clear picture of how real users experience and behave on frontend applications.
A web app session recording is a visual representation of user interactions within an application, created by capturing events like clicks, scrolls, and form inputs in real time. For example, LogRocket records and uses data such as:
The result is a high-fidelity session replay that looks and feels like a video recording, but is really just HTML. User session recordings help developers recreate issues, improve KPIs, and prioritize which bugs to fix by providing insights into how users experience their applications in real-world scenarios.

Frontend performance monitoring can be complex. Popular tools like the following can help streamline the process:
While tools like Datadog and Grafana offer some frontend application monitoring capabilities, you may need to add other tools to get a complete picture of performance metrics, the scope and impact of errors, and the exact way real users experience your application.
A solution like LogRocket provides a comprehensive set of features so your whole team can work from a single source of truth to create better user experiences.
When choosing a frontend performance monitoring solution, consider features like the following:
With these features and more, LogRocket can be an invaluable tool for entire frontend teams, streamlining performance monitoring efforts and ultimately leading to better, more reliable frontend applications.
Install LogRocket in under 3 minutes. Get free access to all features for 14 days. Cancel at any time.