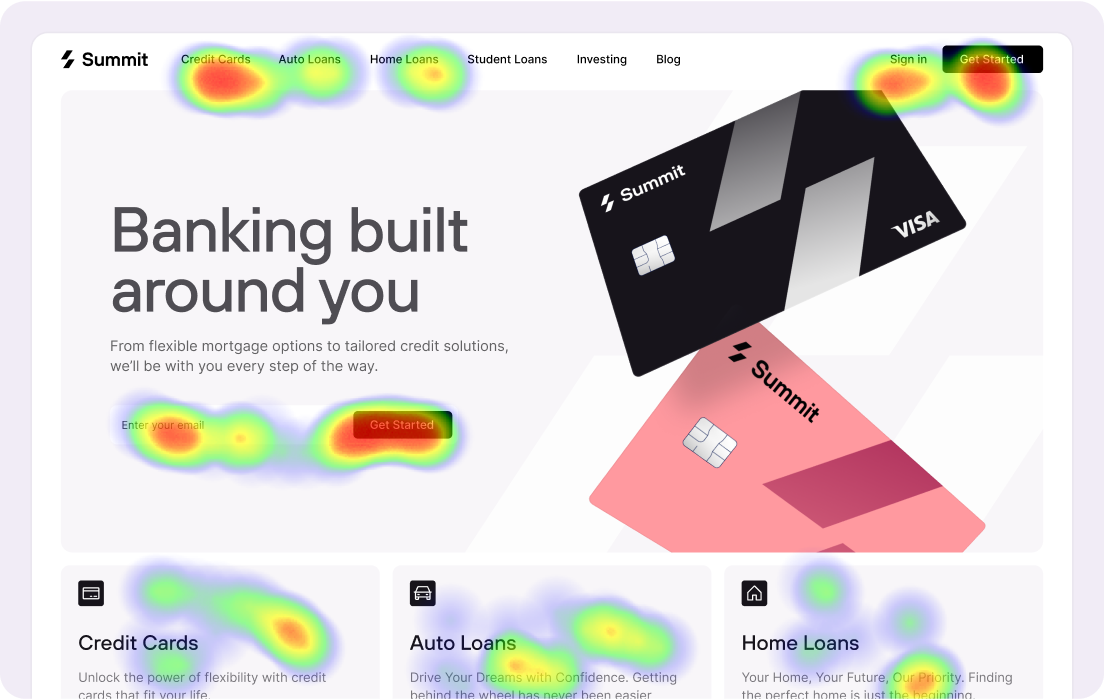
Heatmaps
Reveal an aggregate picture of user interaction on any portion of your app. Know where activity is highest (and lowest), and when users are missing key instructions or actions.
Learn more
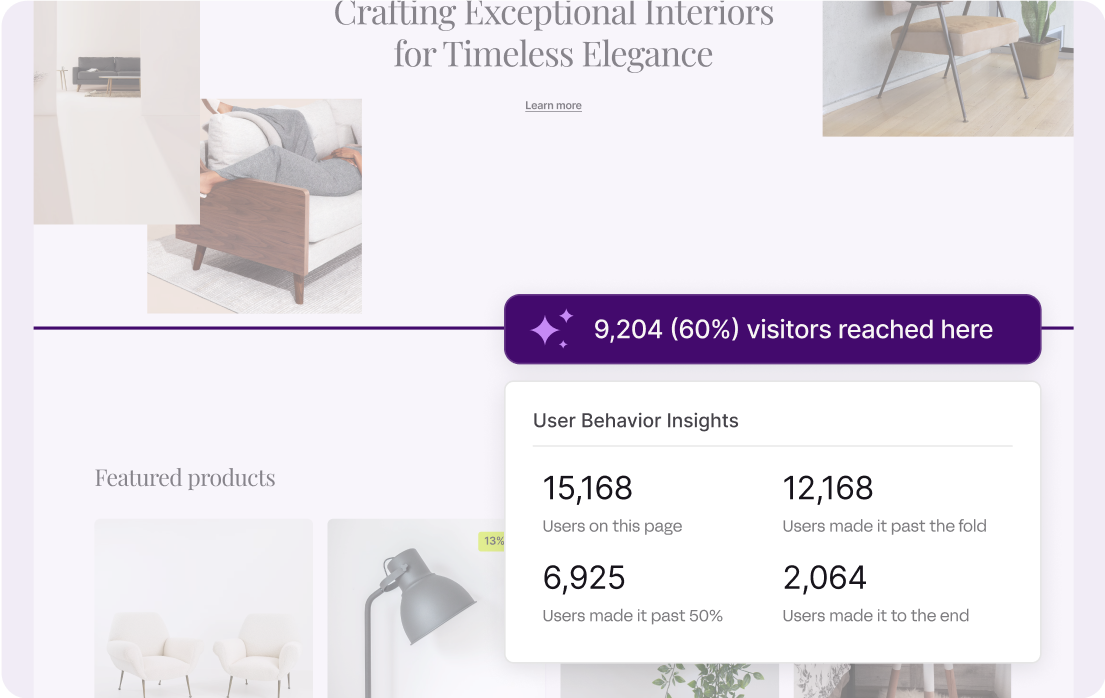
Scrollmaps
See how far users scroll down the page and who is and isn’t seeing critical features, CTAs, and pieces of information.
Learn more
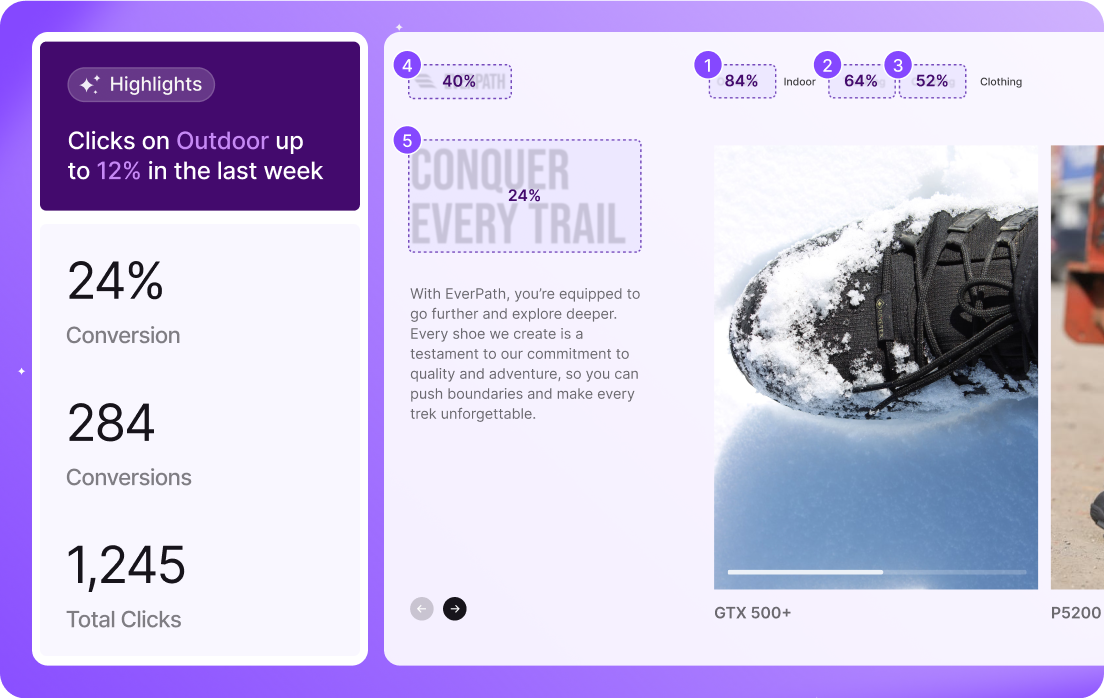
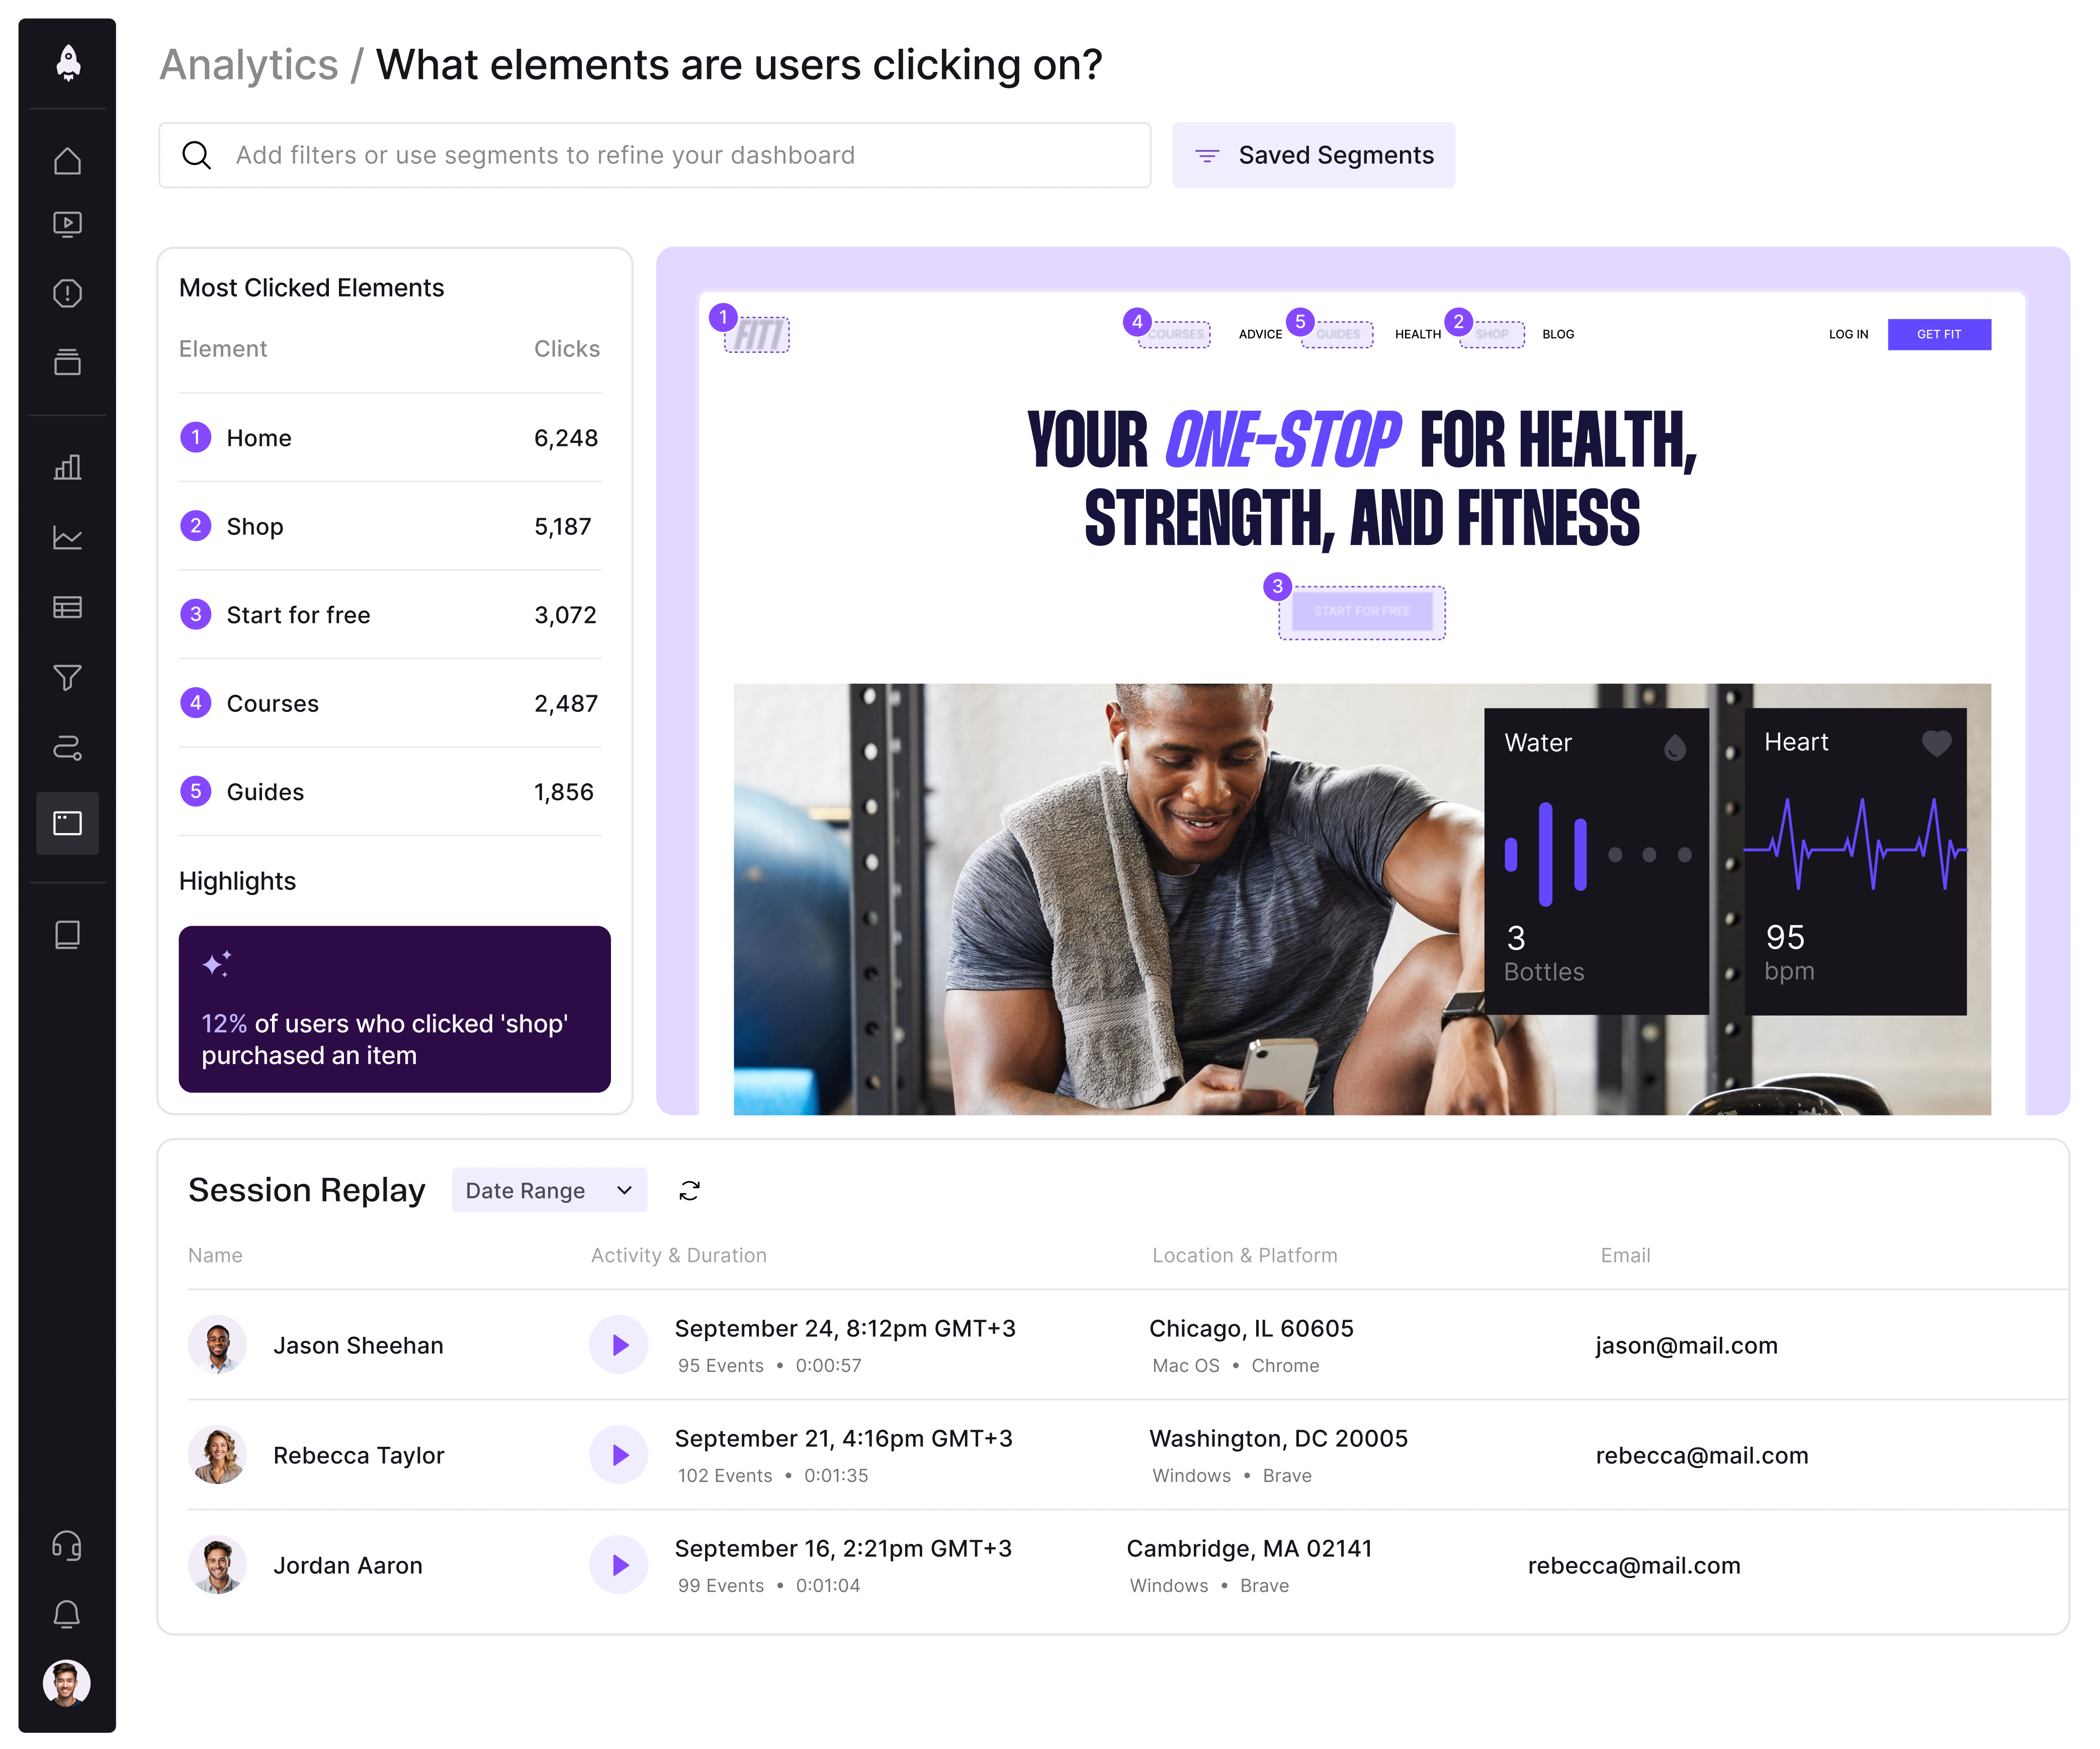
Clickmaps
Visualize where users click the most, whether it’s successful clicks, rage clicks, or dead clicks. Conversion rate clickmaps show which click actions have the highest propensity to convert.
Learn more
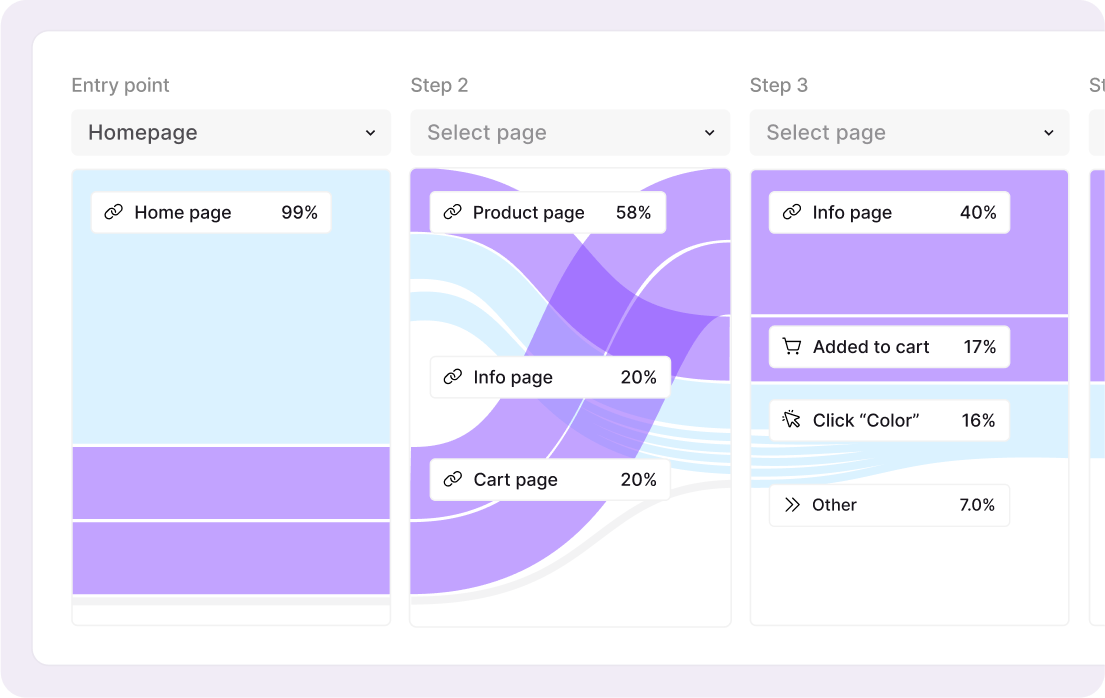
Path analysis
Discover the routes users take to or from different parts of your app, where they drop off, and the issues they experience along the way.
Learn more
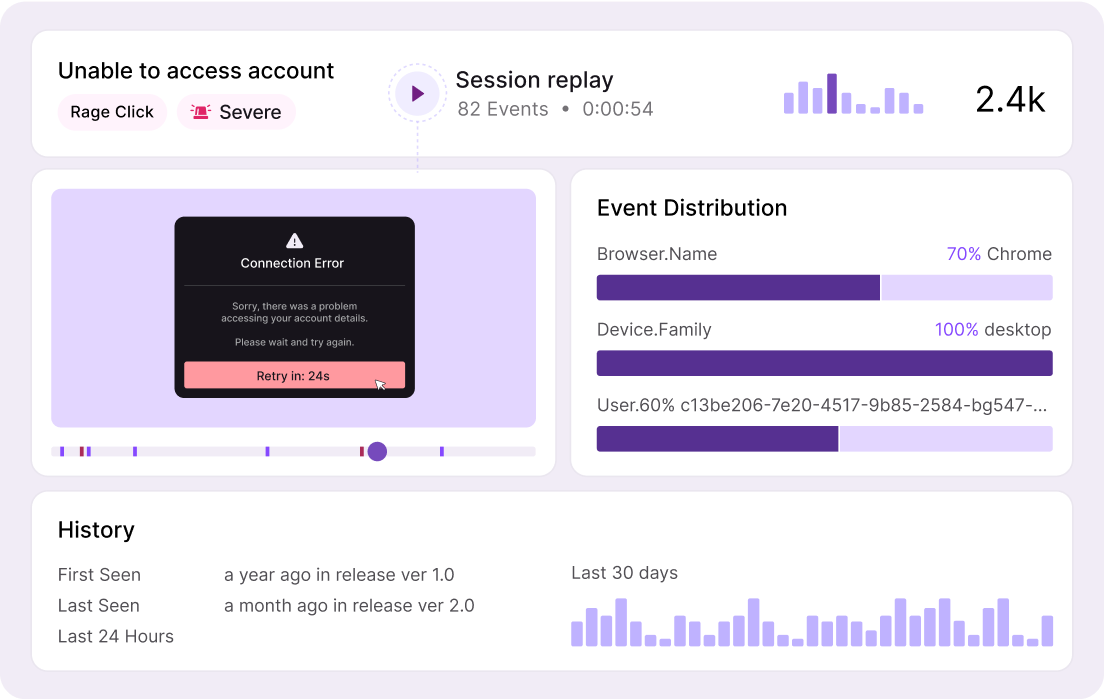
UX Issues
Surface the high-impact rage clicks, dead clicks, and Error States that hamper the user experience. Tune out the noisy alerts and false positives that don't affect users.
Learn more