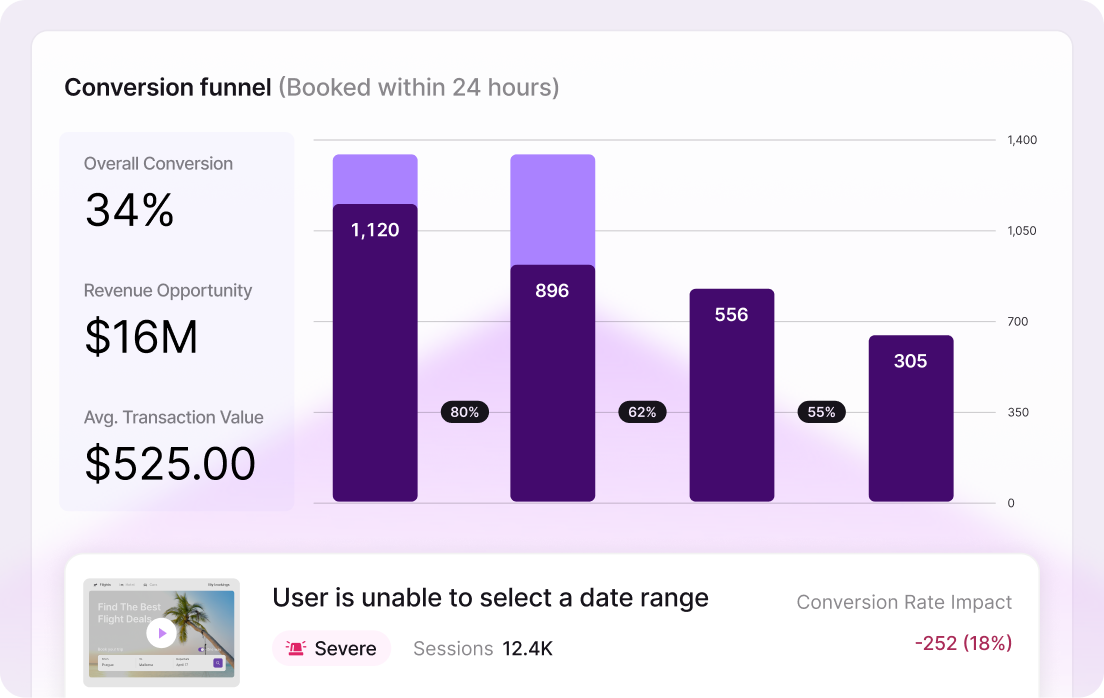
Conversion funnels
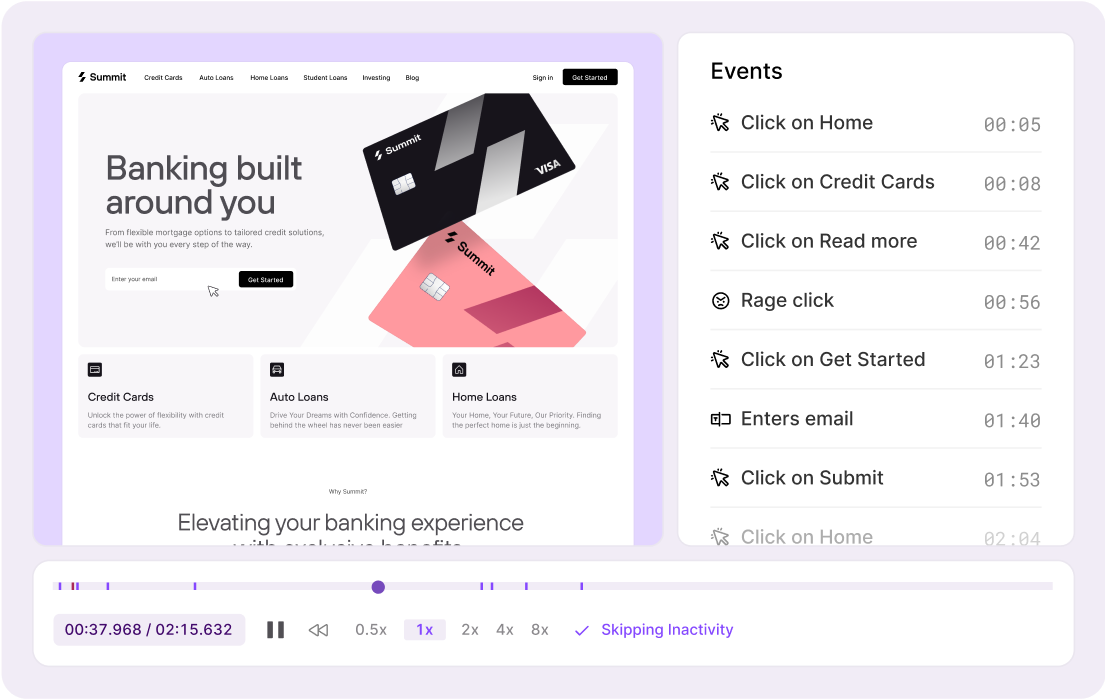
Reveal where users drop off, and watch sessions to get full context. AI-powered funnel insights surface both where users struggle the most before dropping off and the positive signals encouraging conversion.
Learn more
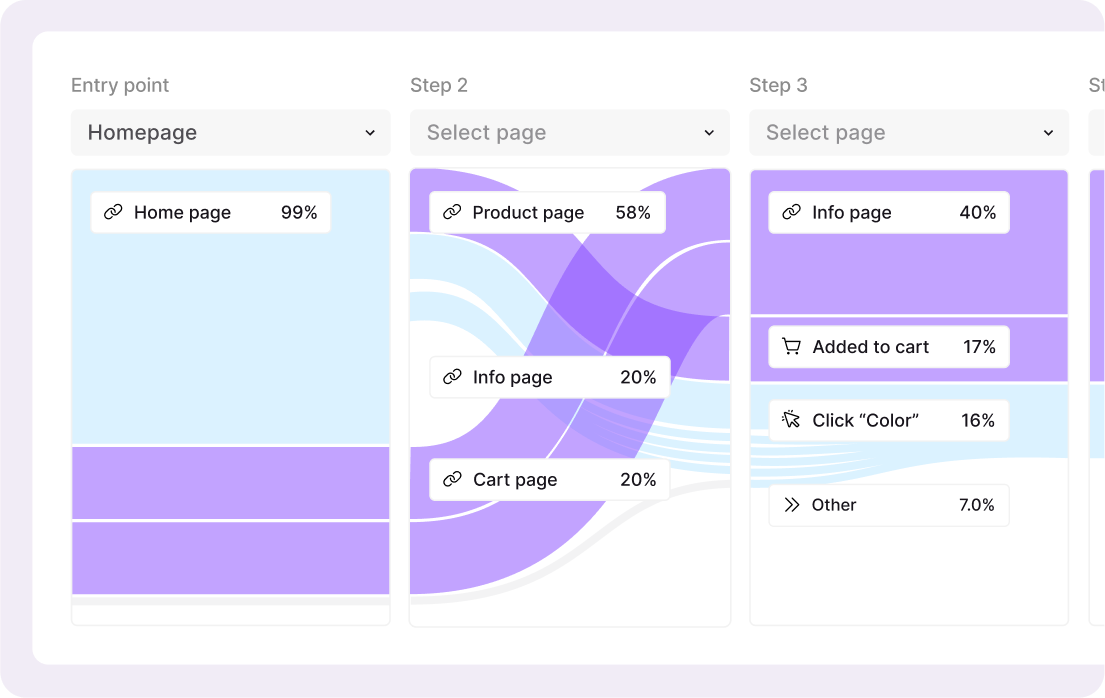
Path analysis
Discover the routes users take to get to or where they go from different parts of your app, where they drop off, and the issues they experience along the way.
Learn more
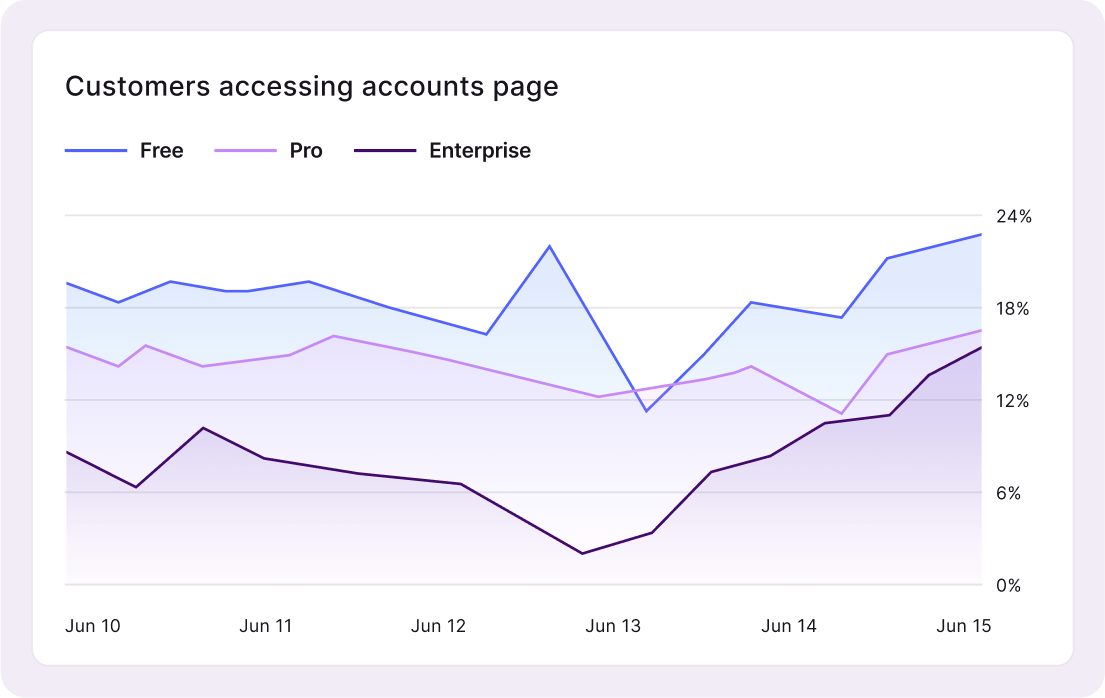
Cohort analysis
Create user cohorts based on behavior, traits, metadata, or any combination of filters. Filter any chart by different cohorts and understand how different user groups behave in your app.
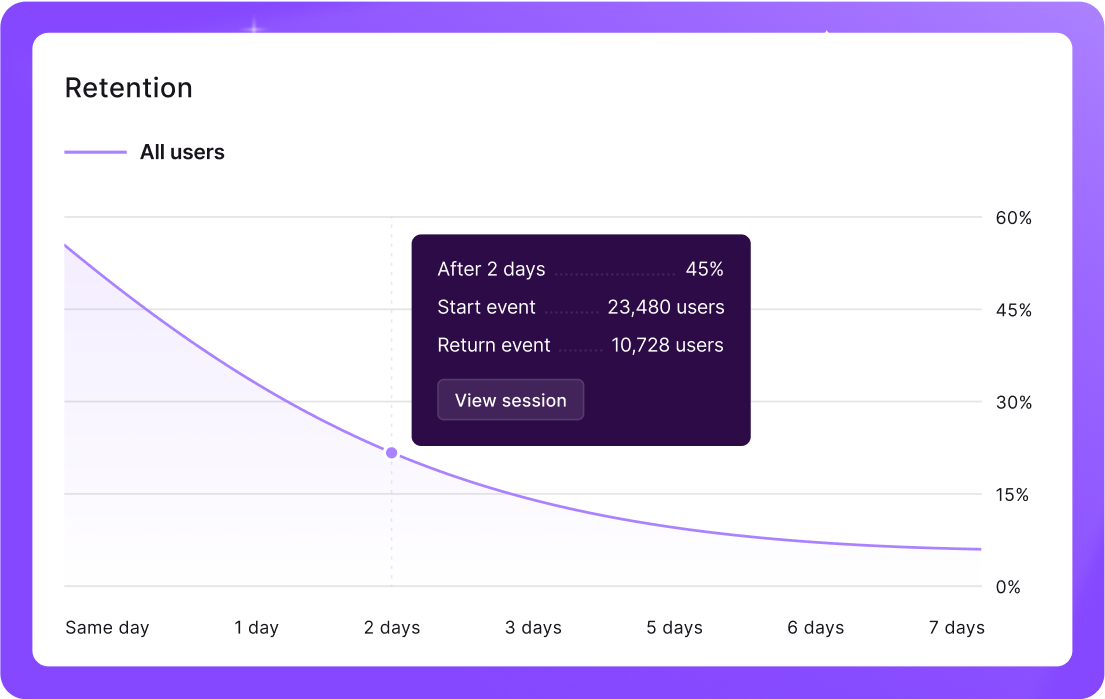
Retention charts
Track the stickiness of products and features. Understand the specific actions that users take that make them more likely to convert and become repeat users.
Learn more
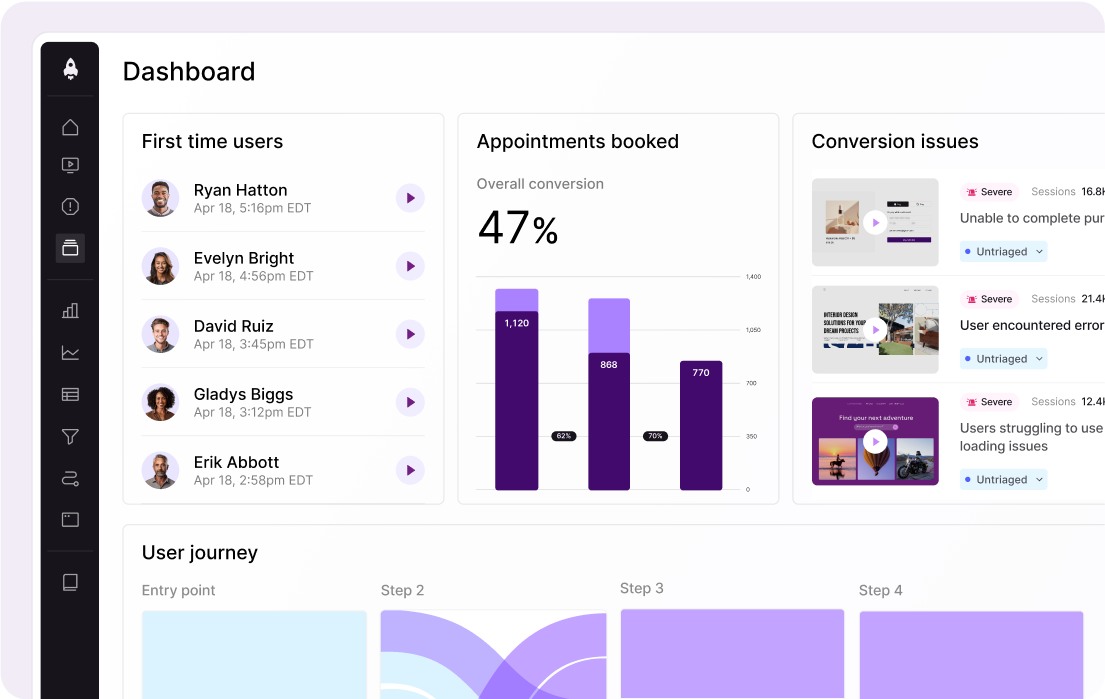
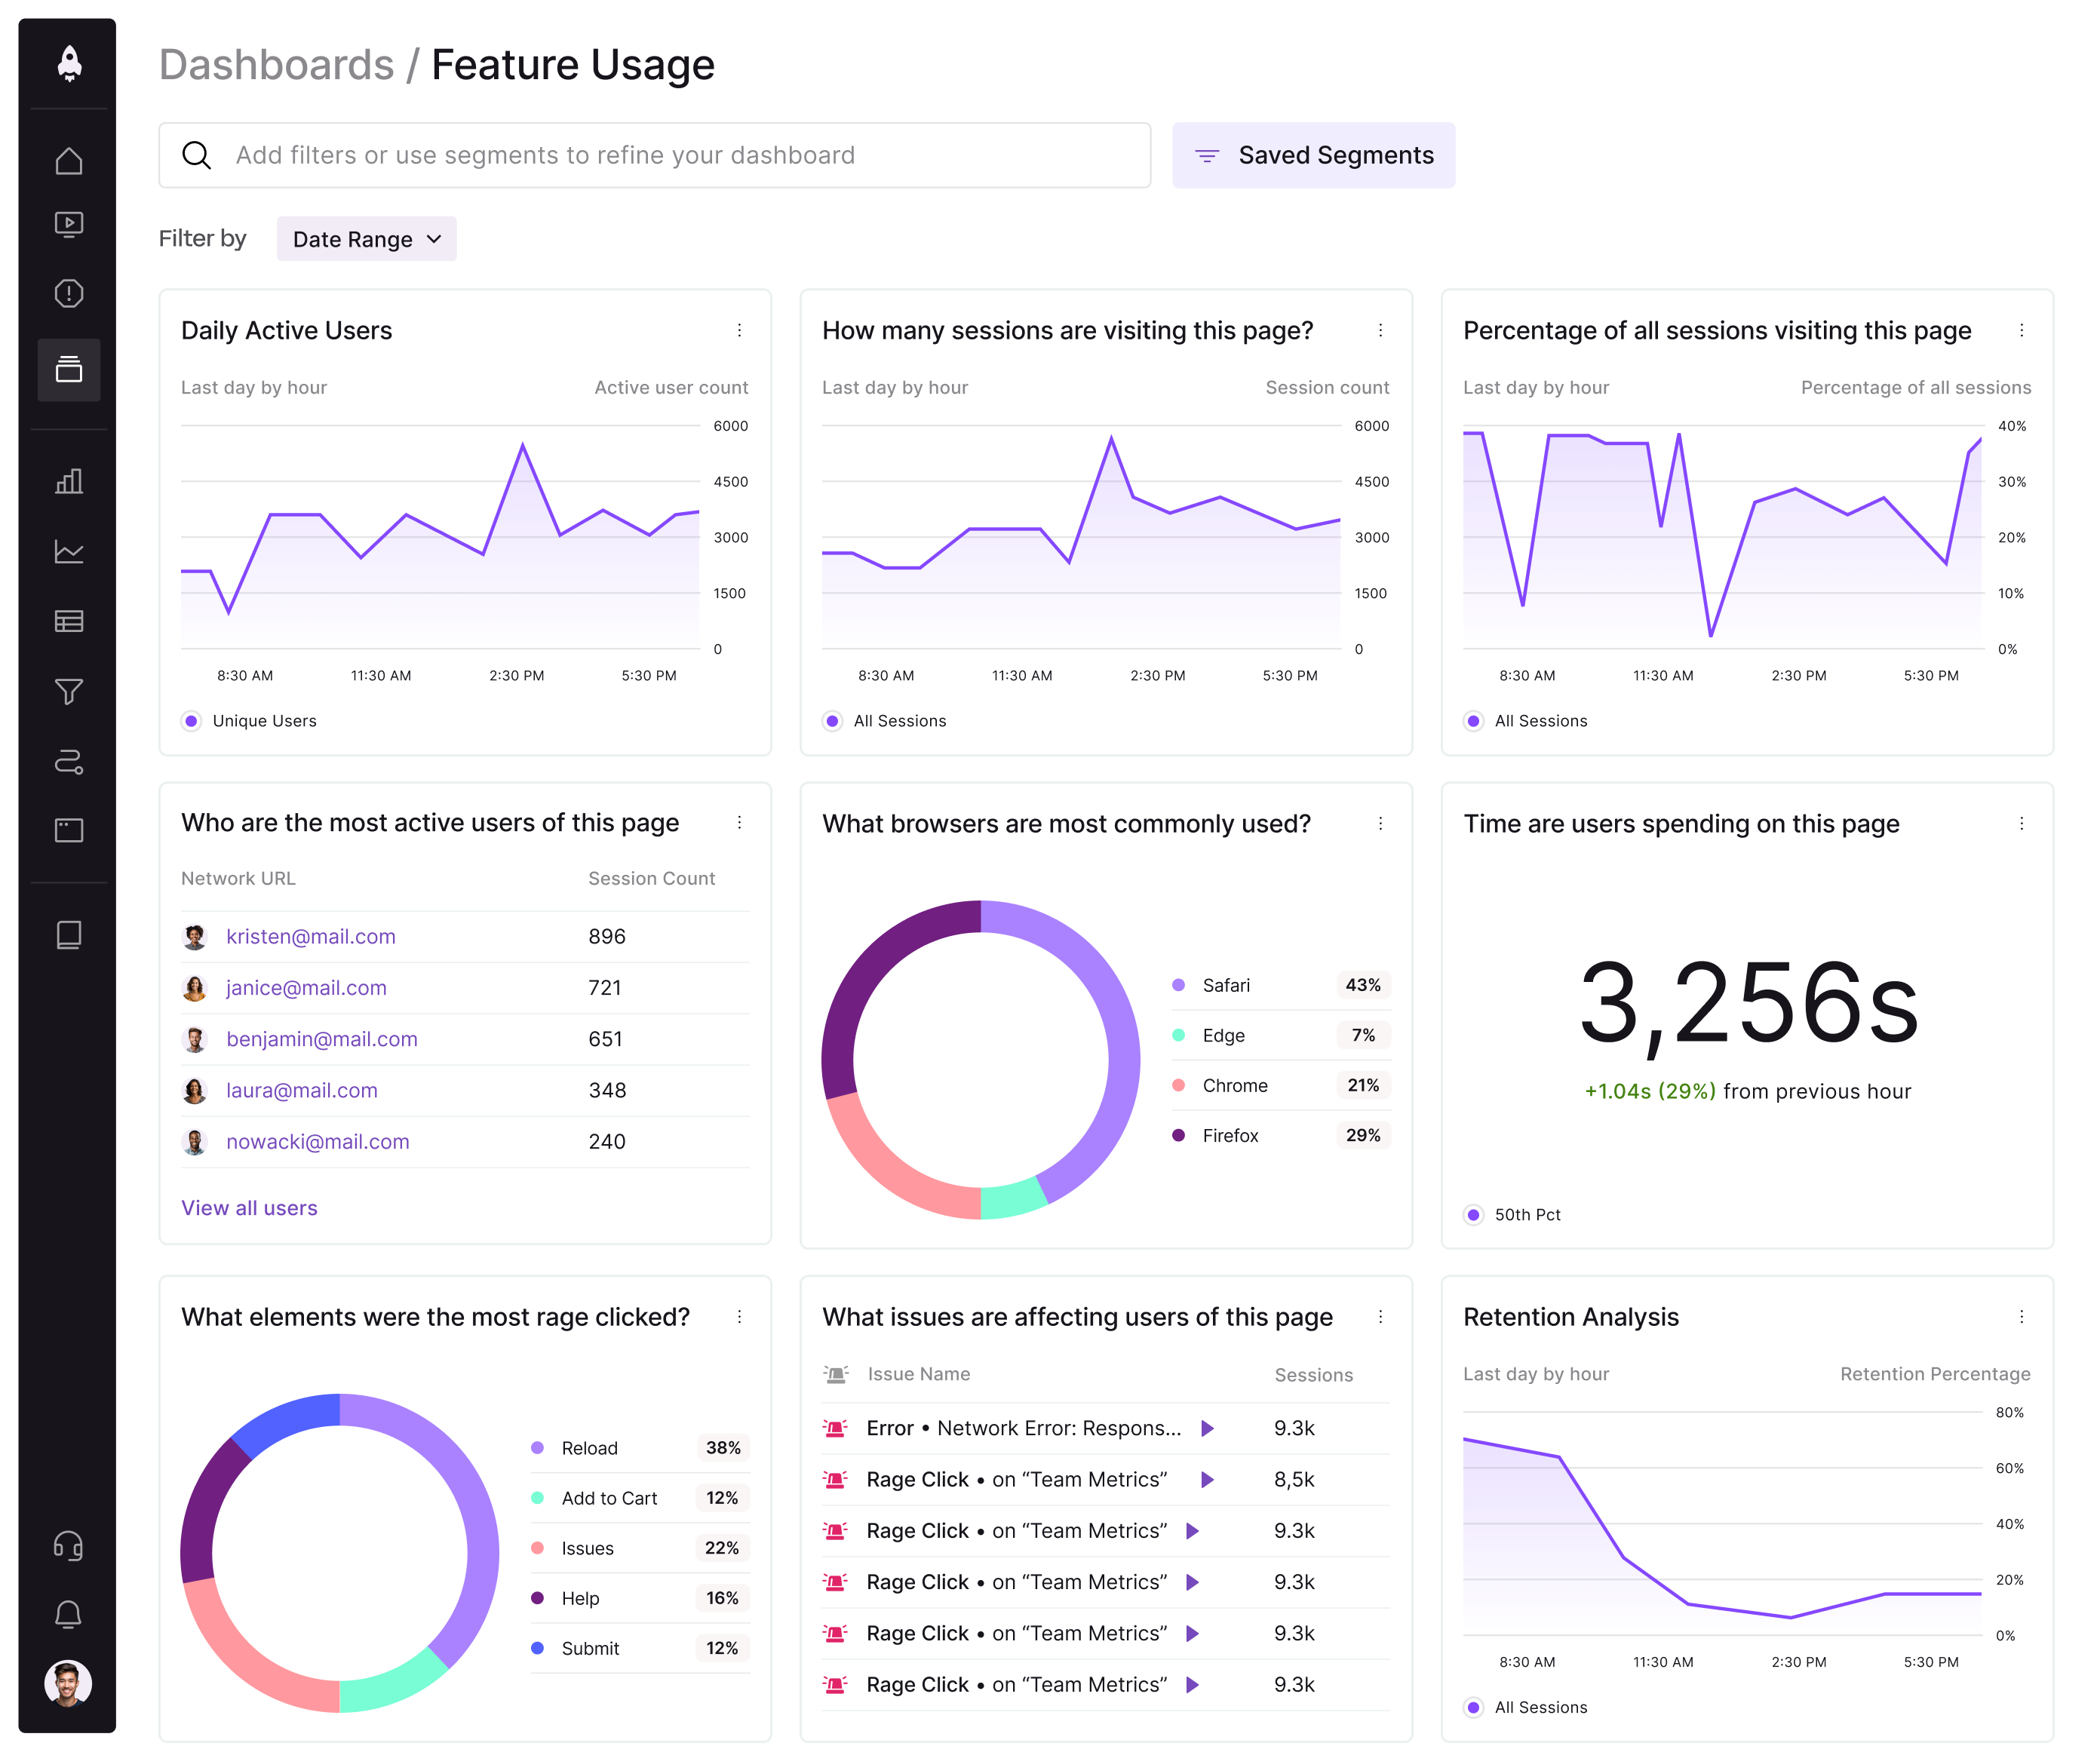
Dashboards
Get started quickly with a set of out-of-the-box dashboards for common use cases, or design custom dashboards tailored to your specific needs.
Learn more
Autocapture & Definitions
Capture every event, page, and action so you can answer any analytics question in seconds, without code changes. Define events in common language for use across your team.
Learn more
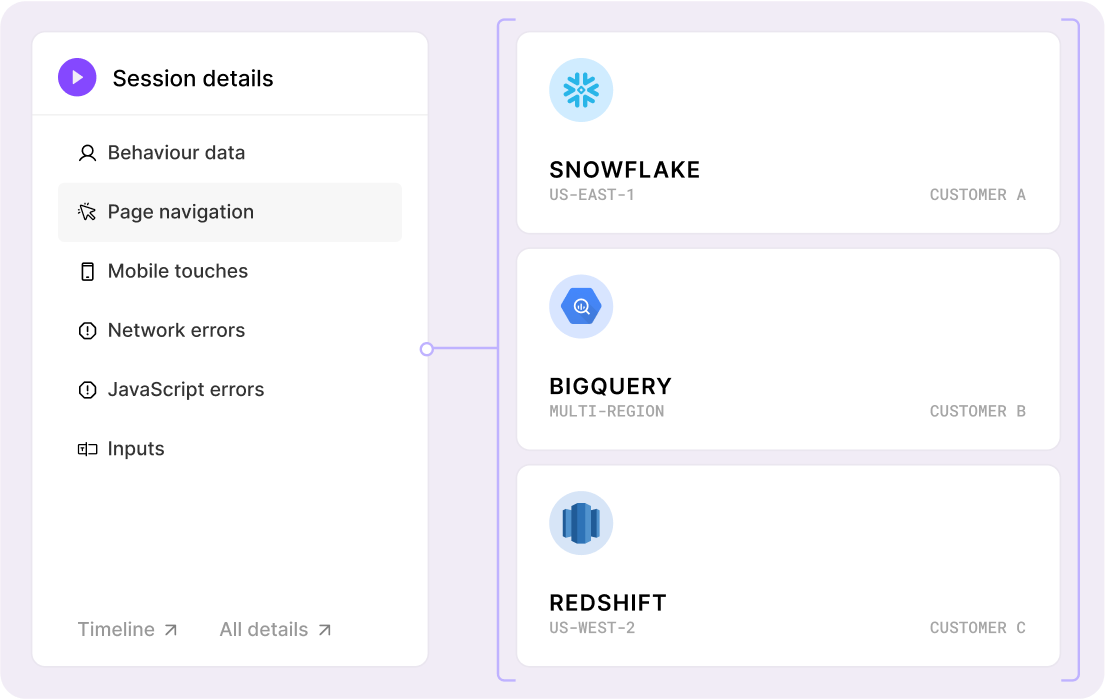
Data export
Export session data via API for additional analysis. Combine LogRocket data with other solutions, or allow your data and business intelligence teams to mine for further insights.
Learn more
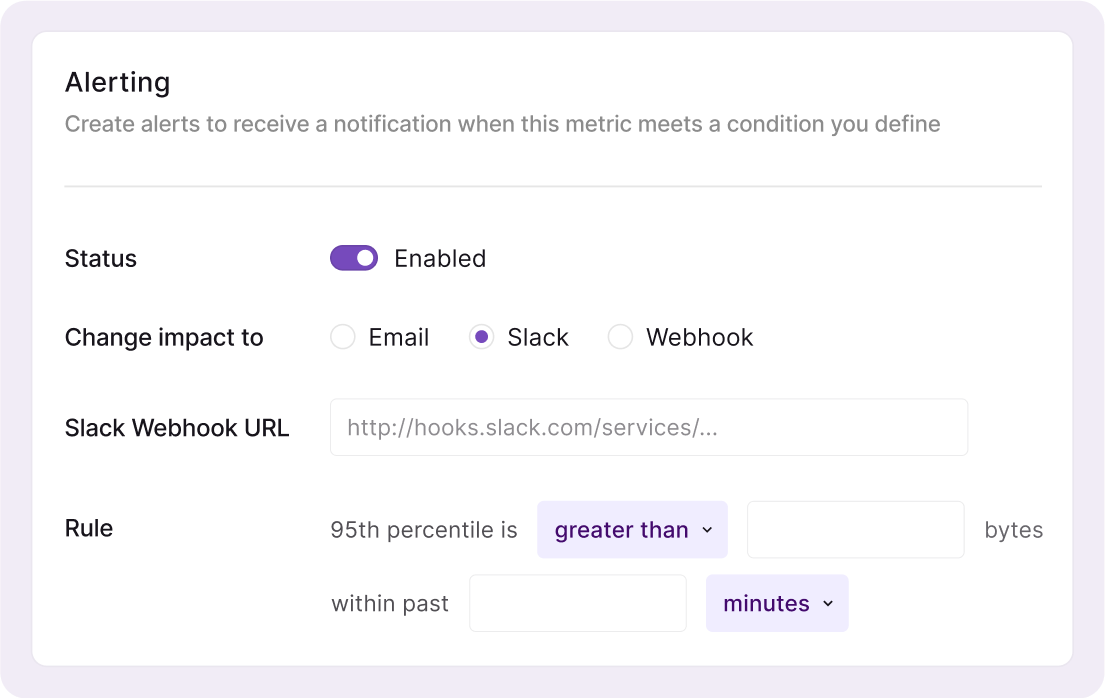
Alerting
Get notified immediately when key metrics drop below desired thresholds to quickly mitigate and resolve any negative impact.
Learn more