JavaScript error logging involves capturing and recording runtime errors in a JavaScript application to help with the debugging process. With the right JavaScript error logging tools, you can quickly detect, track, prioritize, and resolve bugs before your users experience and report them.
The importance of JavaScript error logging
In the past decade, JavaScript applications have become increasingly complex. These powerful tools now run on a wide range of devices, in varying network conditions, and serve users worldwide.
As the demand for feature-rich and responsive web applications continues to grow, developers face new challenges in ensuring the reliability and performance of their apps — making JavaScript error logging an essential component for ensuring top-notch user experiences.
Since it’s nearly impossible to catch every issue during development, JavaScript error logging is more critical than ever for identifying and addressing problems before users experience or report them. By implementing a robust error logging strategy, developers can capture real-time data on errors, providing valuable insights for debugging and improving application performance.
Core features to look for in JavaScript error logging tools
World-class frontend teams rely on JavaScript error logging solutions to capture high-priority issues impacting real users. Here are some essential capabilities an effective error logging tool should have:
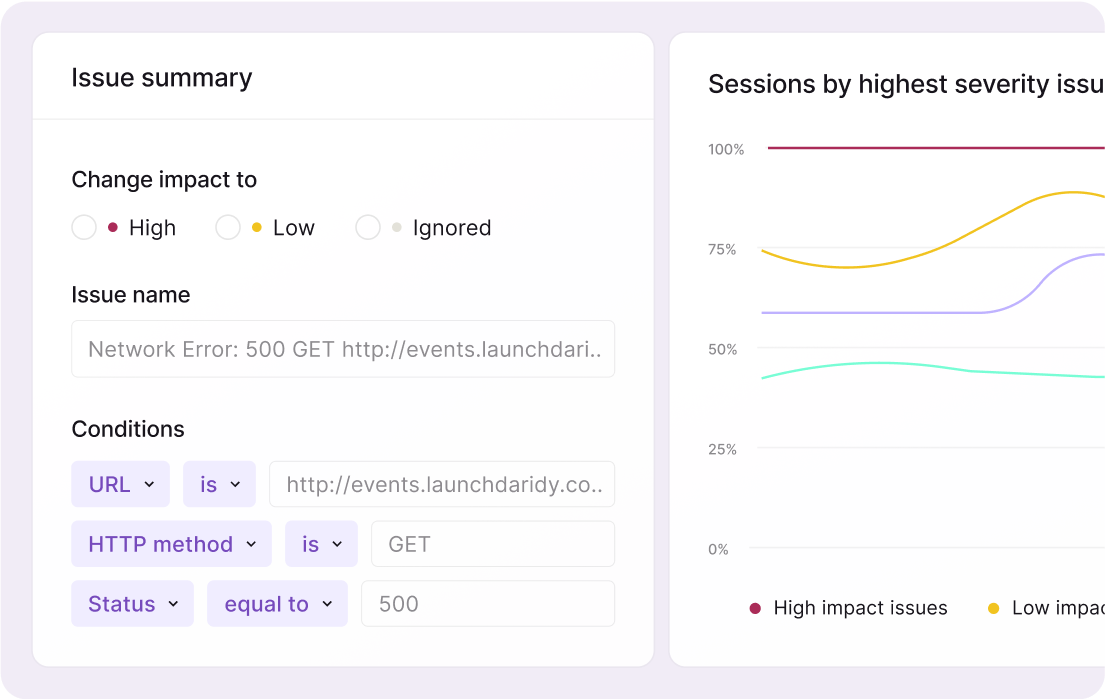
- Group and aggregate issues: Error logging tools should be able to group and aggregate issues, enabling developers to identify the most frequent and severe problems as quickly as possible

- Triage issues: False positives are inevitable in error logging. It's essential to be able to ignore, classify, and prioritize issues to reduce noise and focus on fixing the most critical problems
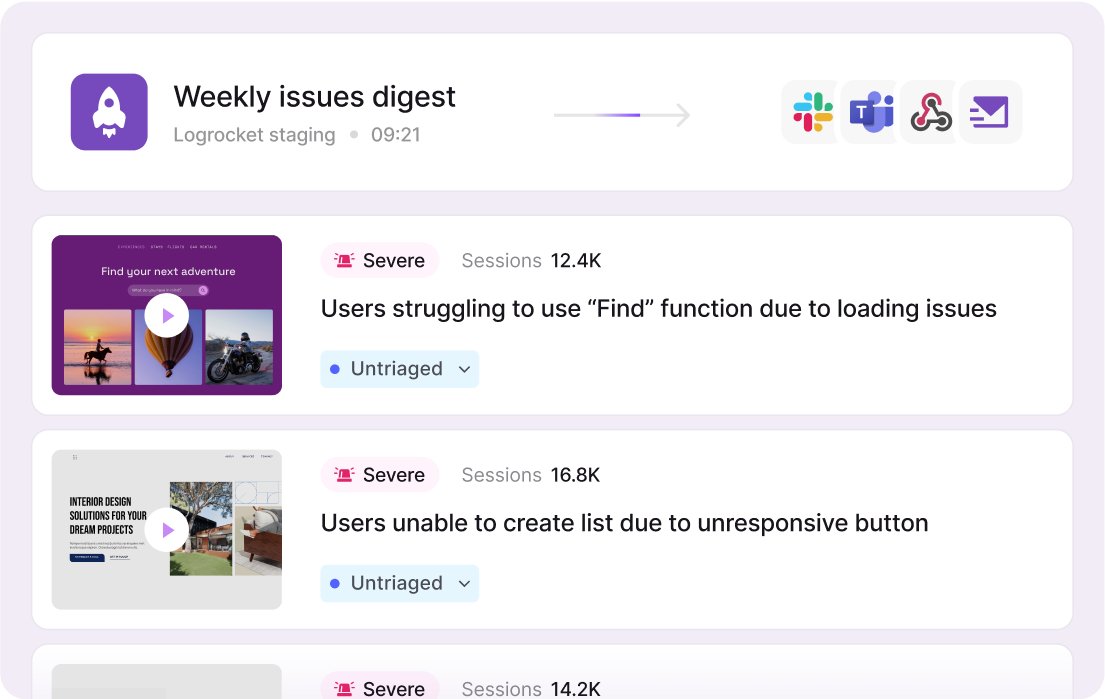
- Alerting: Real-time alerts and notifications are crucial for staying informed about issues as they arise, allowing developers to address them quickly and minimize their impact on the user experience
- Artificial Intelligence: JavaScript error logging can be noisy, lack context, and make issue discovery a challenge. The best solutions use machine learning to filter out irrelevant data and highlight the most impactful issues affecting your users

Ideally, the right JavaScript error logging tool will provide these essential features and more in one user-friendly platform, making it easier to focus on the most important problems in your application.
Example JavaScript error logging solutions
There are several popular JavaScript error logging solutions that offer some or all of the capabilities above:
- LogRocket is a comprehensive frontend application monitoring solution that captures errors, performance issues, real user interactions, and more. By providing detailed insights into user experience and application performance, LogRocket enables developers to pinpoint and resolve issues effectively
- Sentry is an open source error tracking tool that offers real-time monitoring, alerting, and detailed error diagnostics. With an easy-to-use interface and powerful error analysis tools, Sentry helps developers identify, prioritize, and fix issues in their applications
- Rollbar is an error monitoring and analytics platform designed to streamline error tracking, triage, and resolution. It offers real-time error monitoring, detailed error diagnostics, and customizable alerting options to keep developers informed about critical issues
Note that you may need to use multiple tools or collaborate across teams to completely understand the error you’re dealing with and determine your next steps. Without a single source of truth to work from, this can be a time-consuming and inefficient process.
A solution like LogRocket incorporates various tool types and features into a single platform. This means you can immediately and easily gather insights, connect quantitative analytics with qualitative data, and share information with your team to properly scope the impact and reach of a problem before prioritizing a fix.
Integrating error logging tools with popular JavaScript frameworks
Modern JavaScript error logging solutions should integrate seamlessly with popular JavaScript frameworks to provide more tailored error tracking and insights:
- React: Error boundaries in React allow developers to catch and handle errors within their component tree. Many error logging tools offer SDKs or integration guides for use with React applications, making it easy to incorporate error logging into your app's architecture
- Angular: In Angular, developers can extend the built-in
ErrorHandlerclass to implement custom error handling logic. Error logging tools often provide Angular-specific SDKs or integration guides, simplifying the process of adding error logging capabilities to Angular applications - Vue: Developers who use Vue.js can implement a global error handler by adding an
errorHandlerfunction to their Vue instance. Many error logging tools offer integration guides or SDKs for Vue.js, making it simple to incorporate error logging into Vue applications
With framework-specific insights into how JavaScript errors affect your application’s performance, you can resolve bugs more quickly and efficiently.
Adding context with logging
In order to make your error reports as actionable as possible, it’s helpful to add extra logging in your app using the built-in console methods so you can understand the root cause of each issue:
console.log(): The most versatile of the options. Developers can pass anything to the browser console, including strings, objects, and arrays.console.log()is also particularly useful for proactive debugging, such as sending a certain message if a function behaves abnormallyconsole.error(): An error will trigger a different display in the console (a red “x”) and will be highlighted red. Anerror()message is automatically triggered on exceptions but can also be manually triggered if an expected outcome does not occurconsole.warning(): Behaves like anerror()orlog()message, but more often used for important information like deprecations, alerts about using something incorrectly, letting a developer know about missing dependencies, and moreconsole.info(): Behaves almost exactly likelog(), but could be used to keep different kinds of log messages organized; you can filter to seeinfo()rather thanlog()- Stack traces: Will show a snippet of the last step before the issue occurred, the exact error with a message, and the file, line number, and column number indicating where the issue occurred within a function or script
These console methods are easy to use and require no additional setup. The information they provide can help you prioritize issues and better understand what went wrong and why.
Why LogRocket?
JavaScript error logging is an essential aspect of maintaining high-quality, performant web applications today. By adopting best practices and leveraging the right tools, developers can create resilient, user-friendly applications that meet the expectations of both their end users and their development teams.
LogRocket can help by collecting all your frontend telemetry, including JavaScript error logs, and additionally providing a high-fidelity session replay along with any related errors and all the code-level detail. This allows you to see exactly what the user experienced and the technical context regarding why.
On top of that, you can browse, search, filter, and run analyses on the types of JavaScript errors your users are experiencing. You can also see how many users experienced the issue and whether it affected key business goals, allowing you to better understand the impact and reach of a problem before prioritizing a fix.
Moreover, LogRocket’s Galileo AI automatically watches sessions and identifies, aggregates, and rates the severity of JavaScript errors and other issues. You’ll receive alerts for severe issues that actually affect your users rather than a high volume of false positives. Based on over a billion user interactions, LogRocket Galileo will leave you confident that you’re spending your time on the most impactful issues affecting your users.
With all this data, you can easily collaborate across teams to determine whether a bug is worth fixing and ship a solution faster than ever. Find JavaScript errors impacting your goals, watch user sessions to understand and quantify how those issues affect your app’s UX, then route alerts and errors to the right person or team for a fix.
Try it yourself for free!
Install LogRocket in under 3 minutes. Get free access to all features for 14 days. Cancel at any time.